eWeLink Community Knowledge Base
Read and interpret logs
When you having issues with eWeLink supported devices having their own life (like ghost switching) it can be quite a hassle to find out the exact cause. Often it is caused by badly installed wiring or induction. Sometimes it is caused by the software part of the eWeLink platform. Logs can help you to find out whether an issue is being caused by software. This article explains where to find the logs and how to interpret them.
Index
There are 2 types of logs in the eWeLink app and one of them does have 2 subtypes:
- Device logs
- Scene logs
Device logs
The best place to start is at the the device logs. Unfortunately not every device has it but if it does it can become very handy in investigating an issue.
Step 1
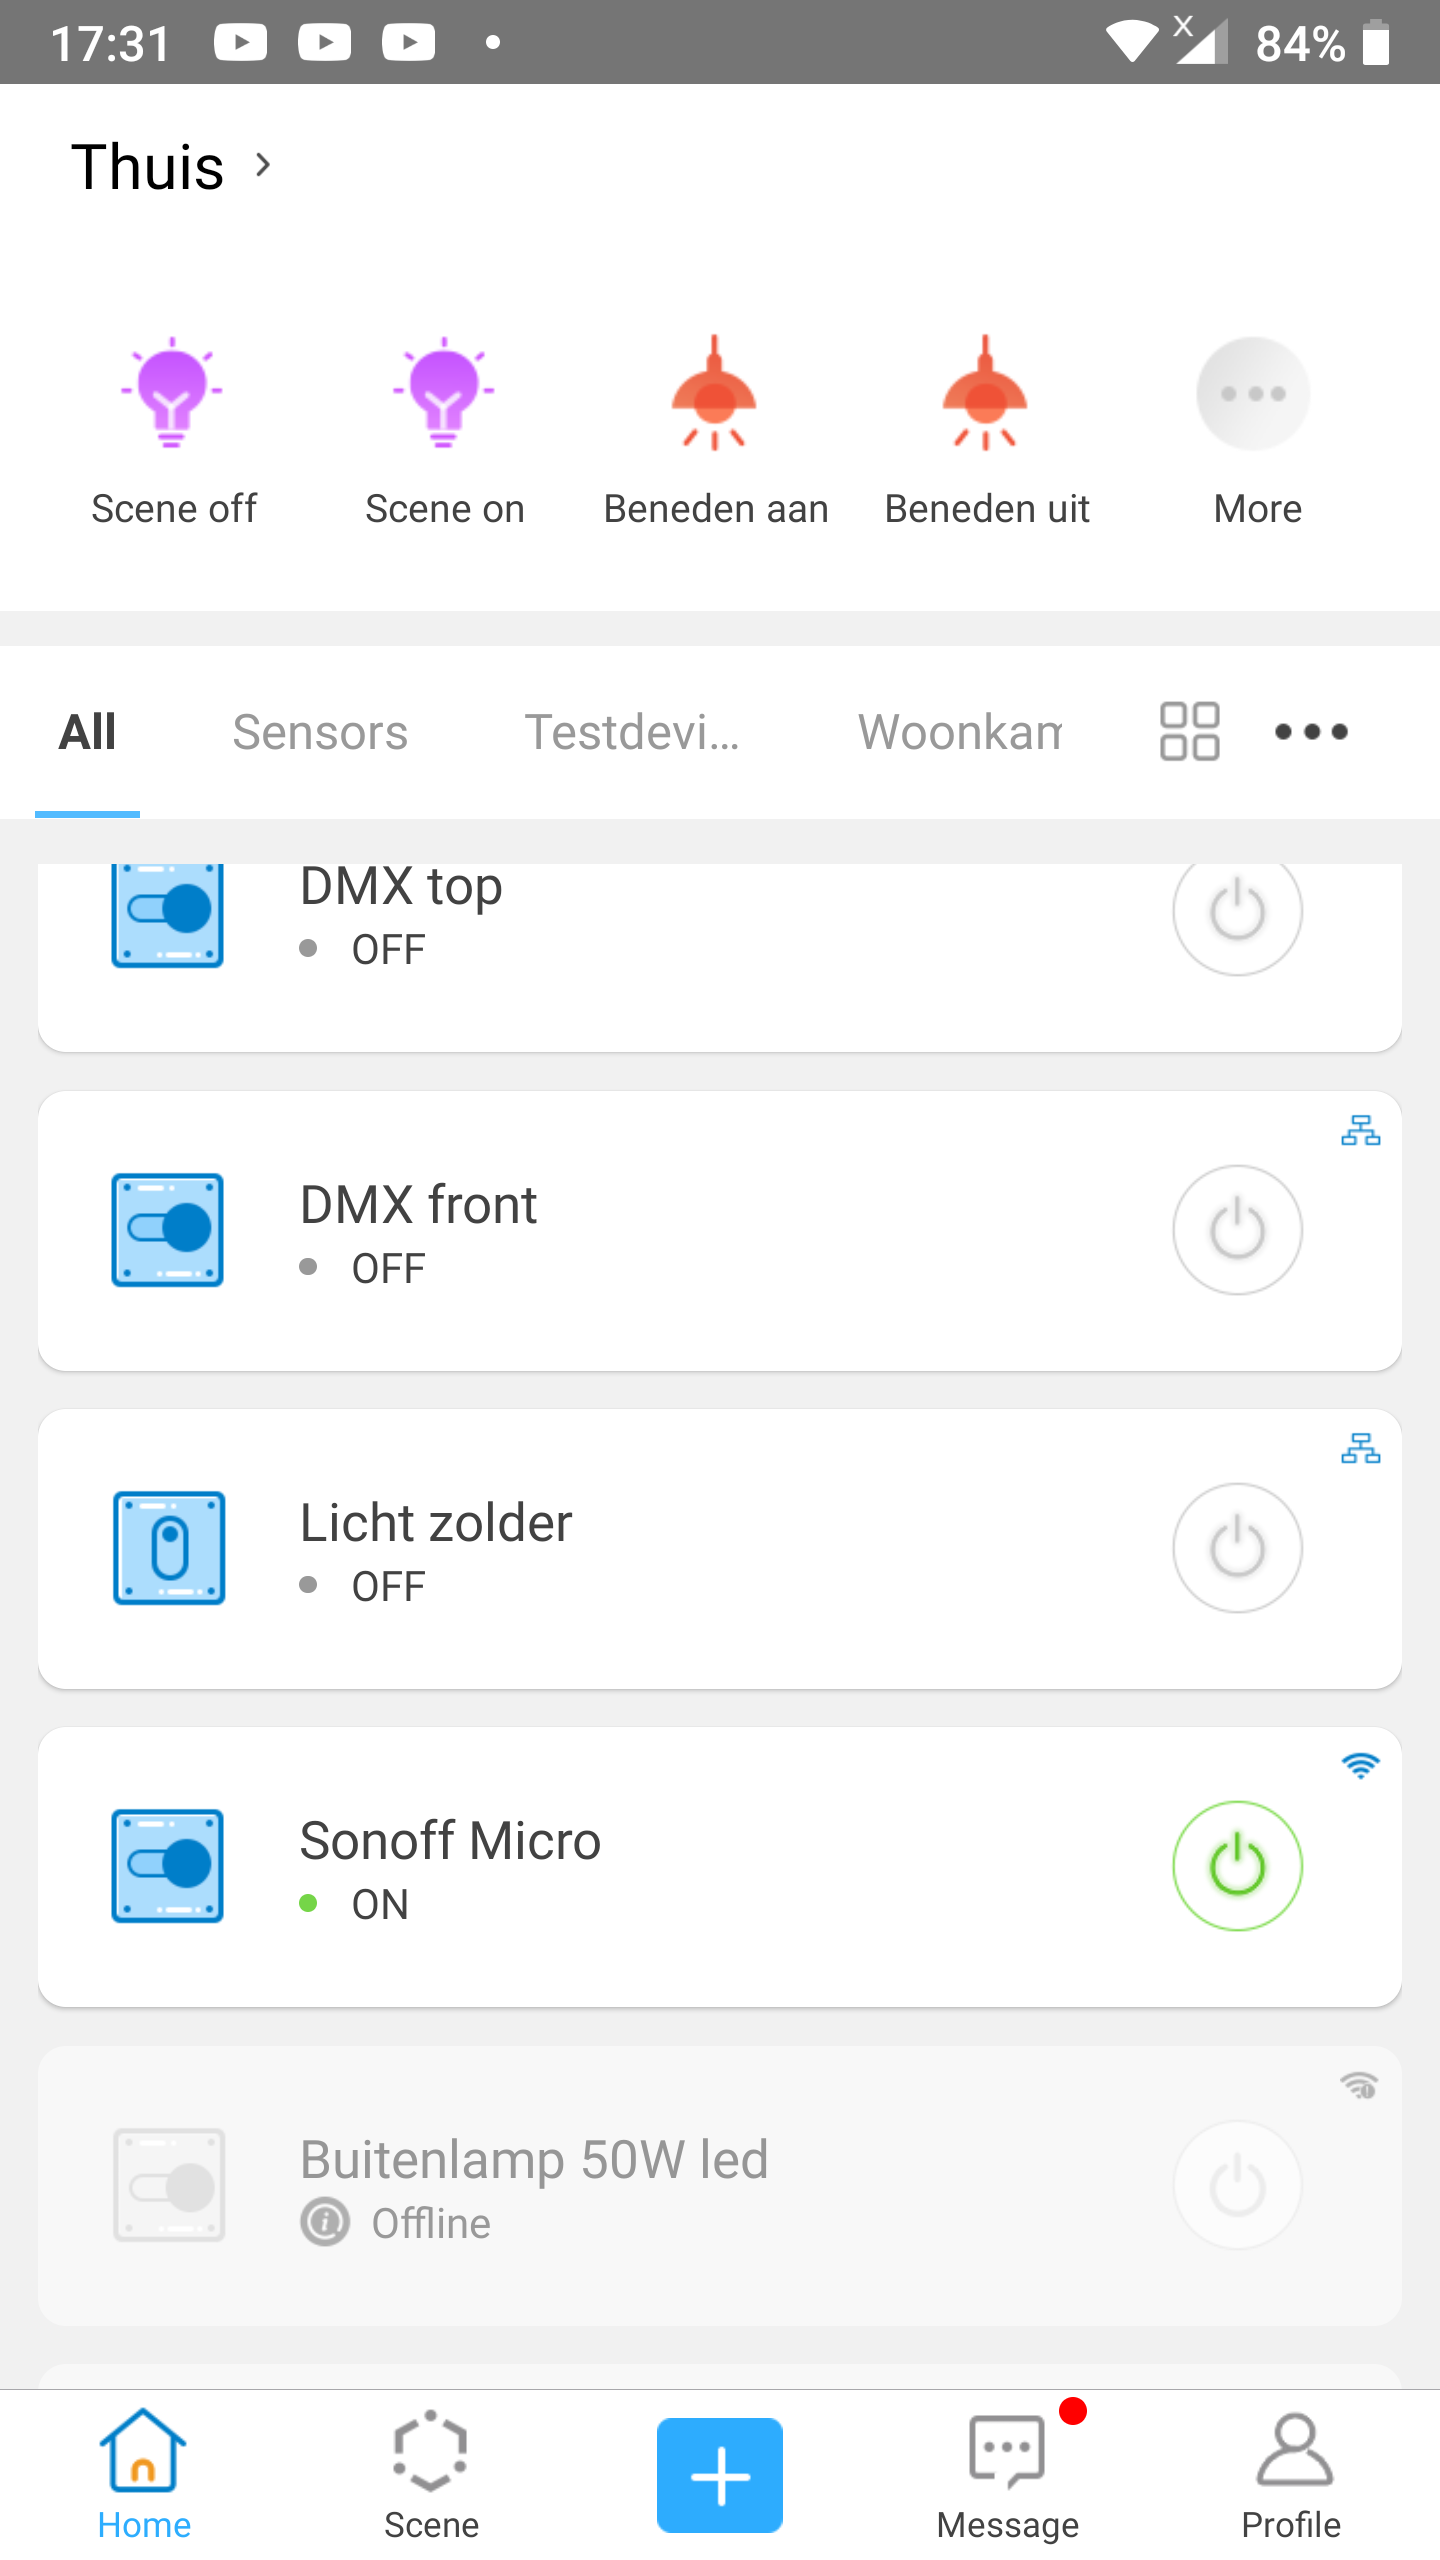
- On the
Homescreen scroll to the device you want to view the logs of.- In our example we want to view the logs of
Sonoff Micro.
- In our example we want to view the logs of
- Tap on the name of that device.
Step 2
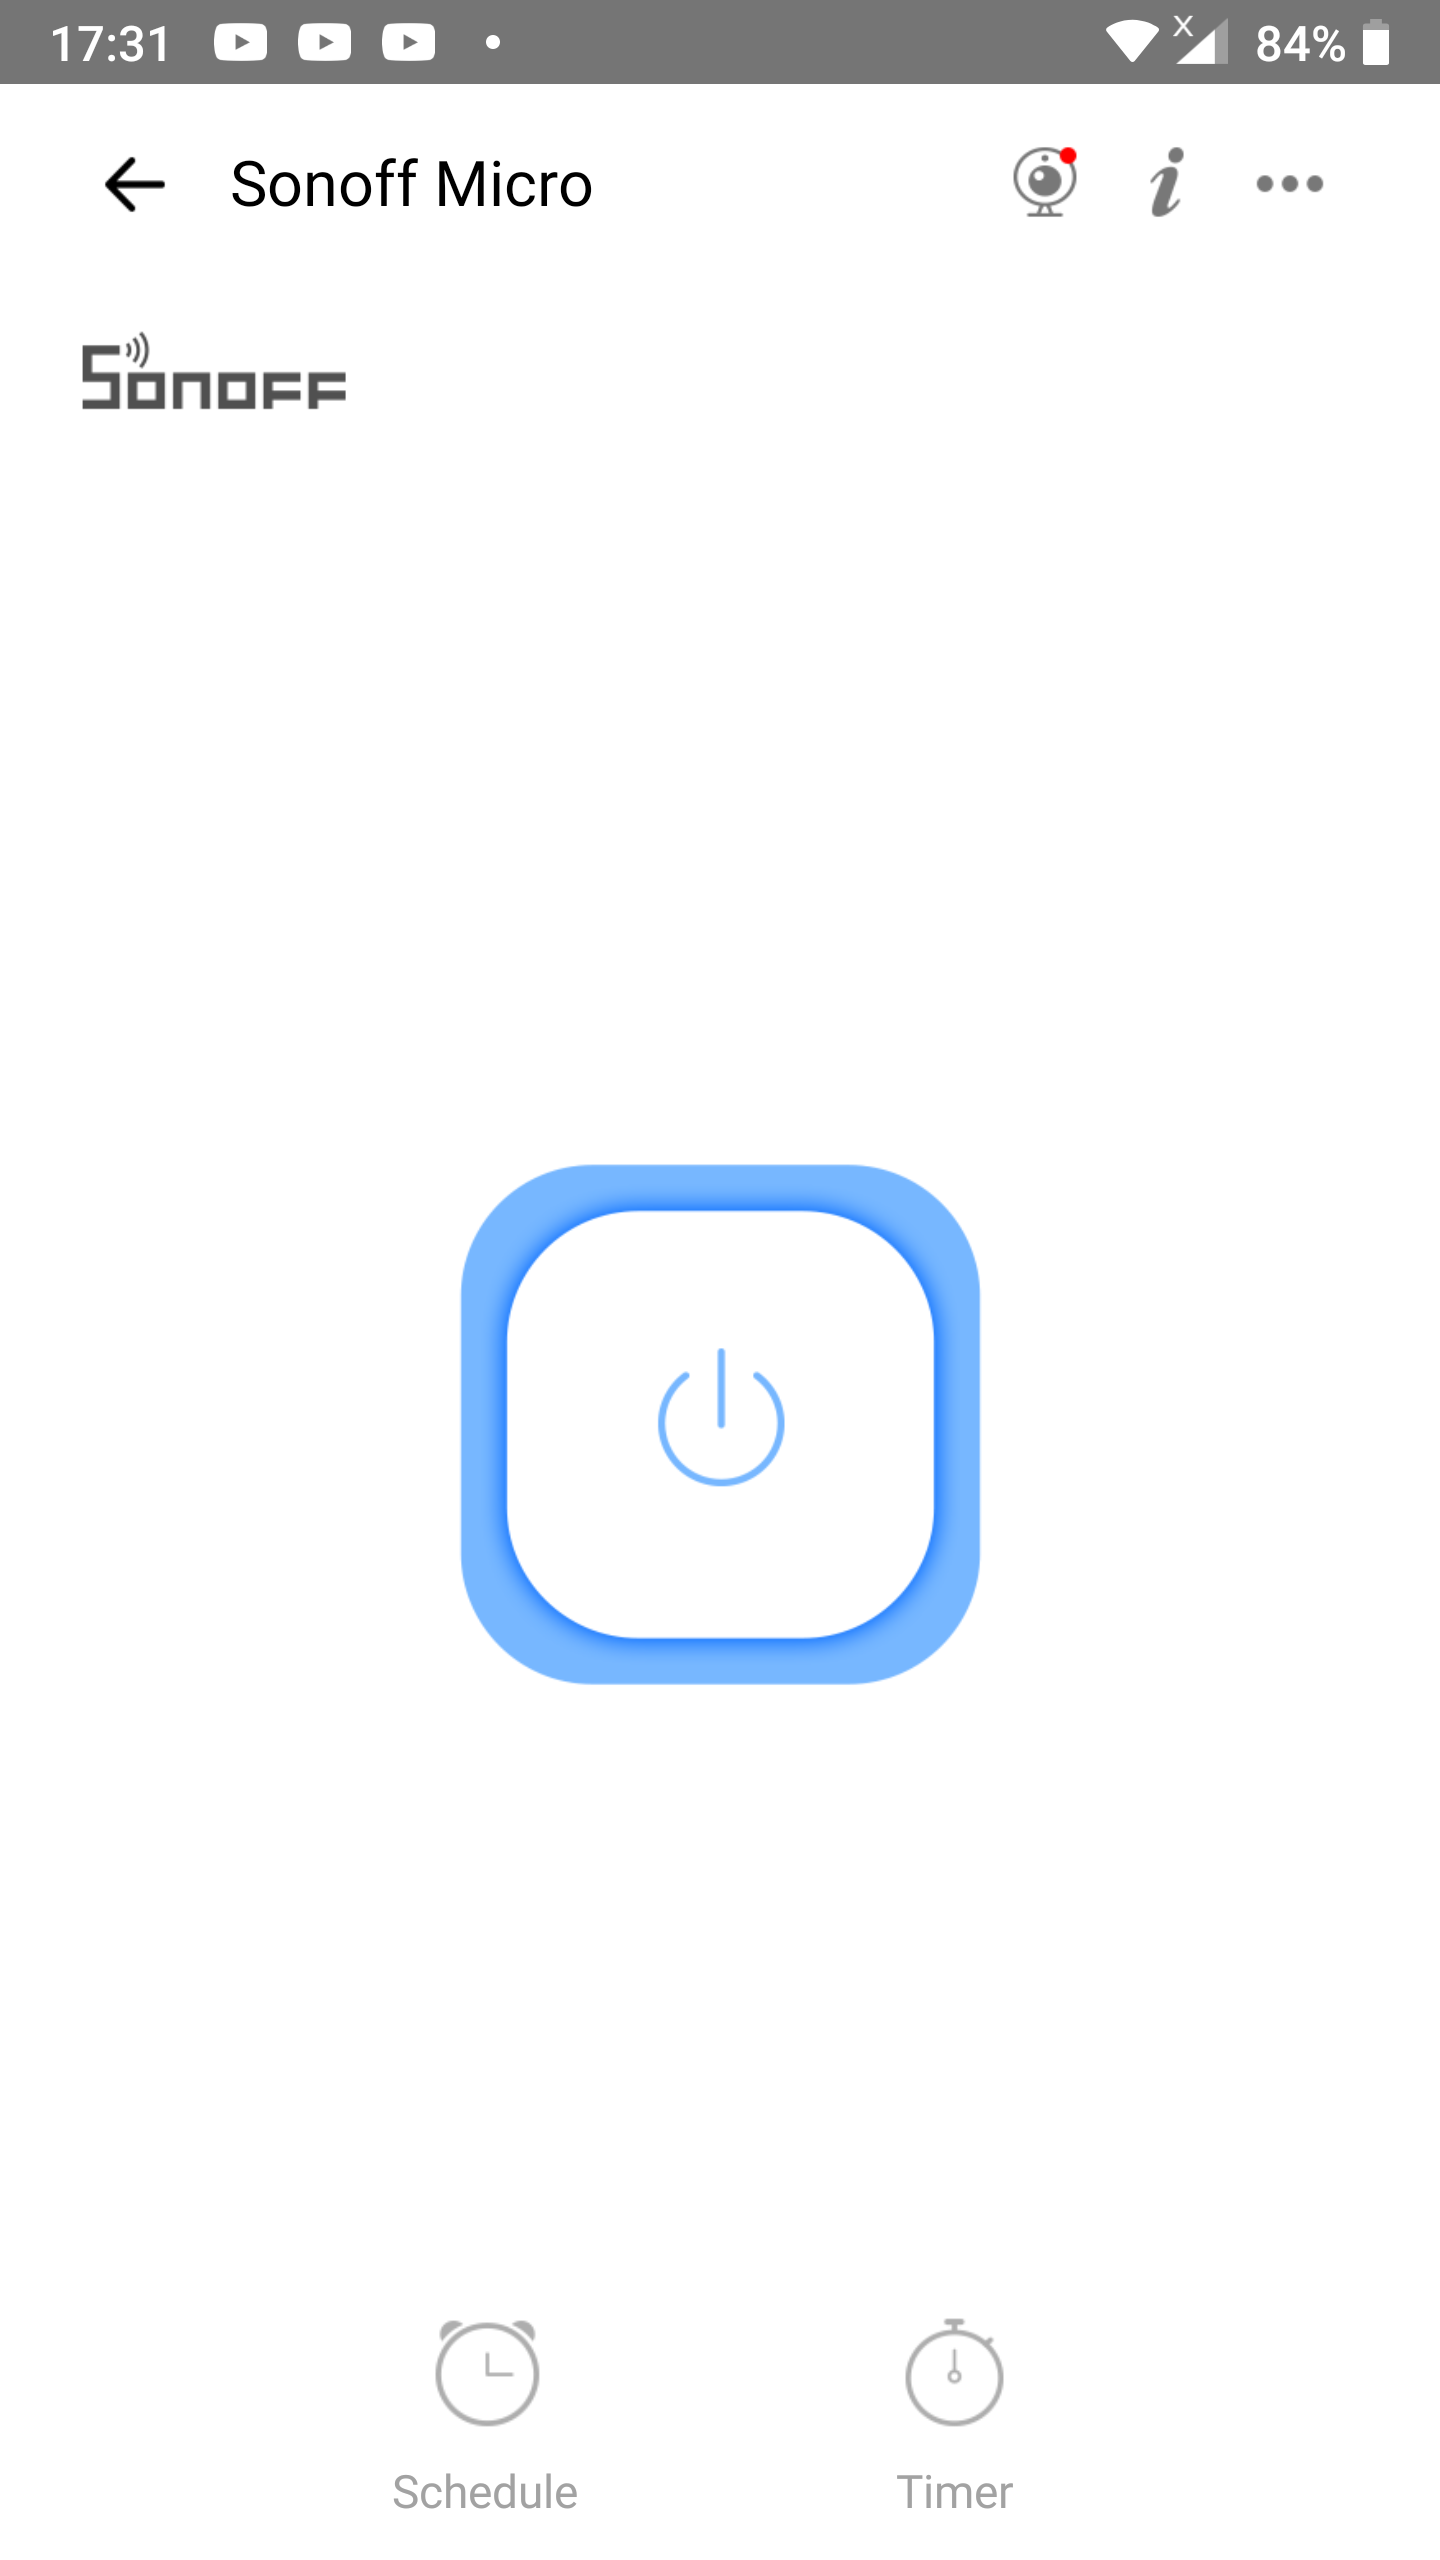
- Tap the 3-dots icon of the overflow menu in the upper right corner.
Step 3
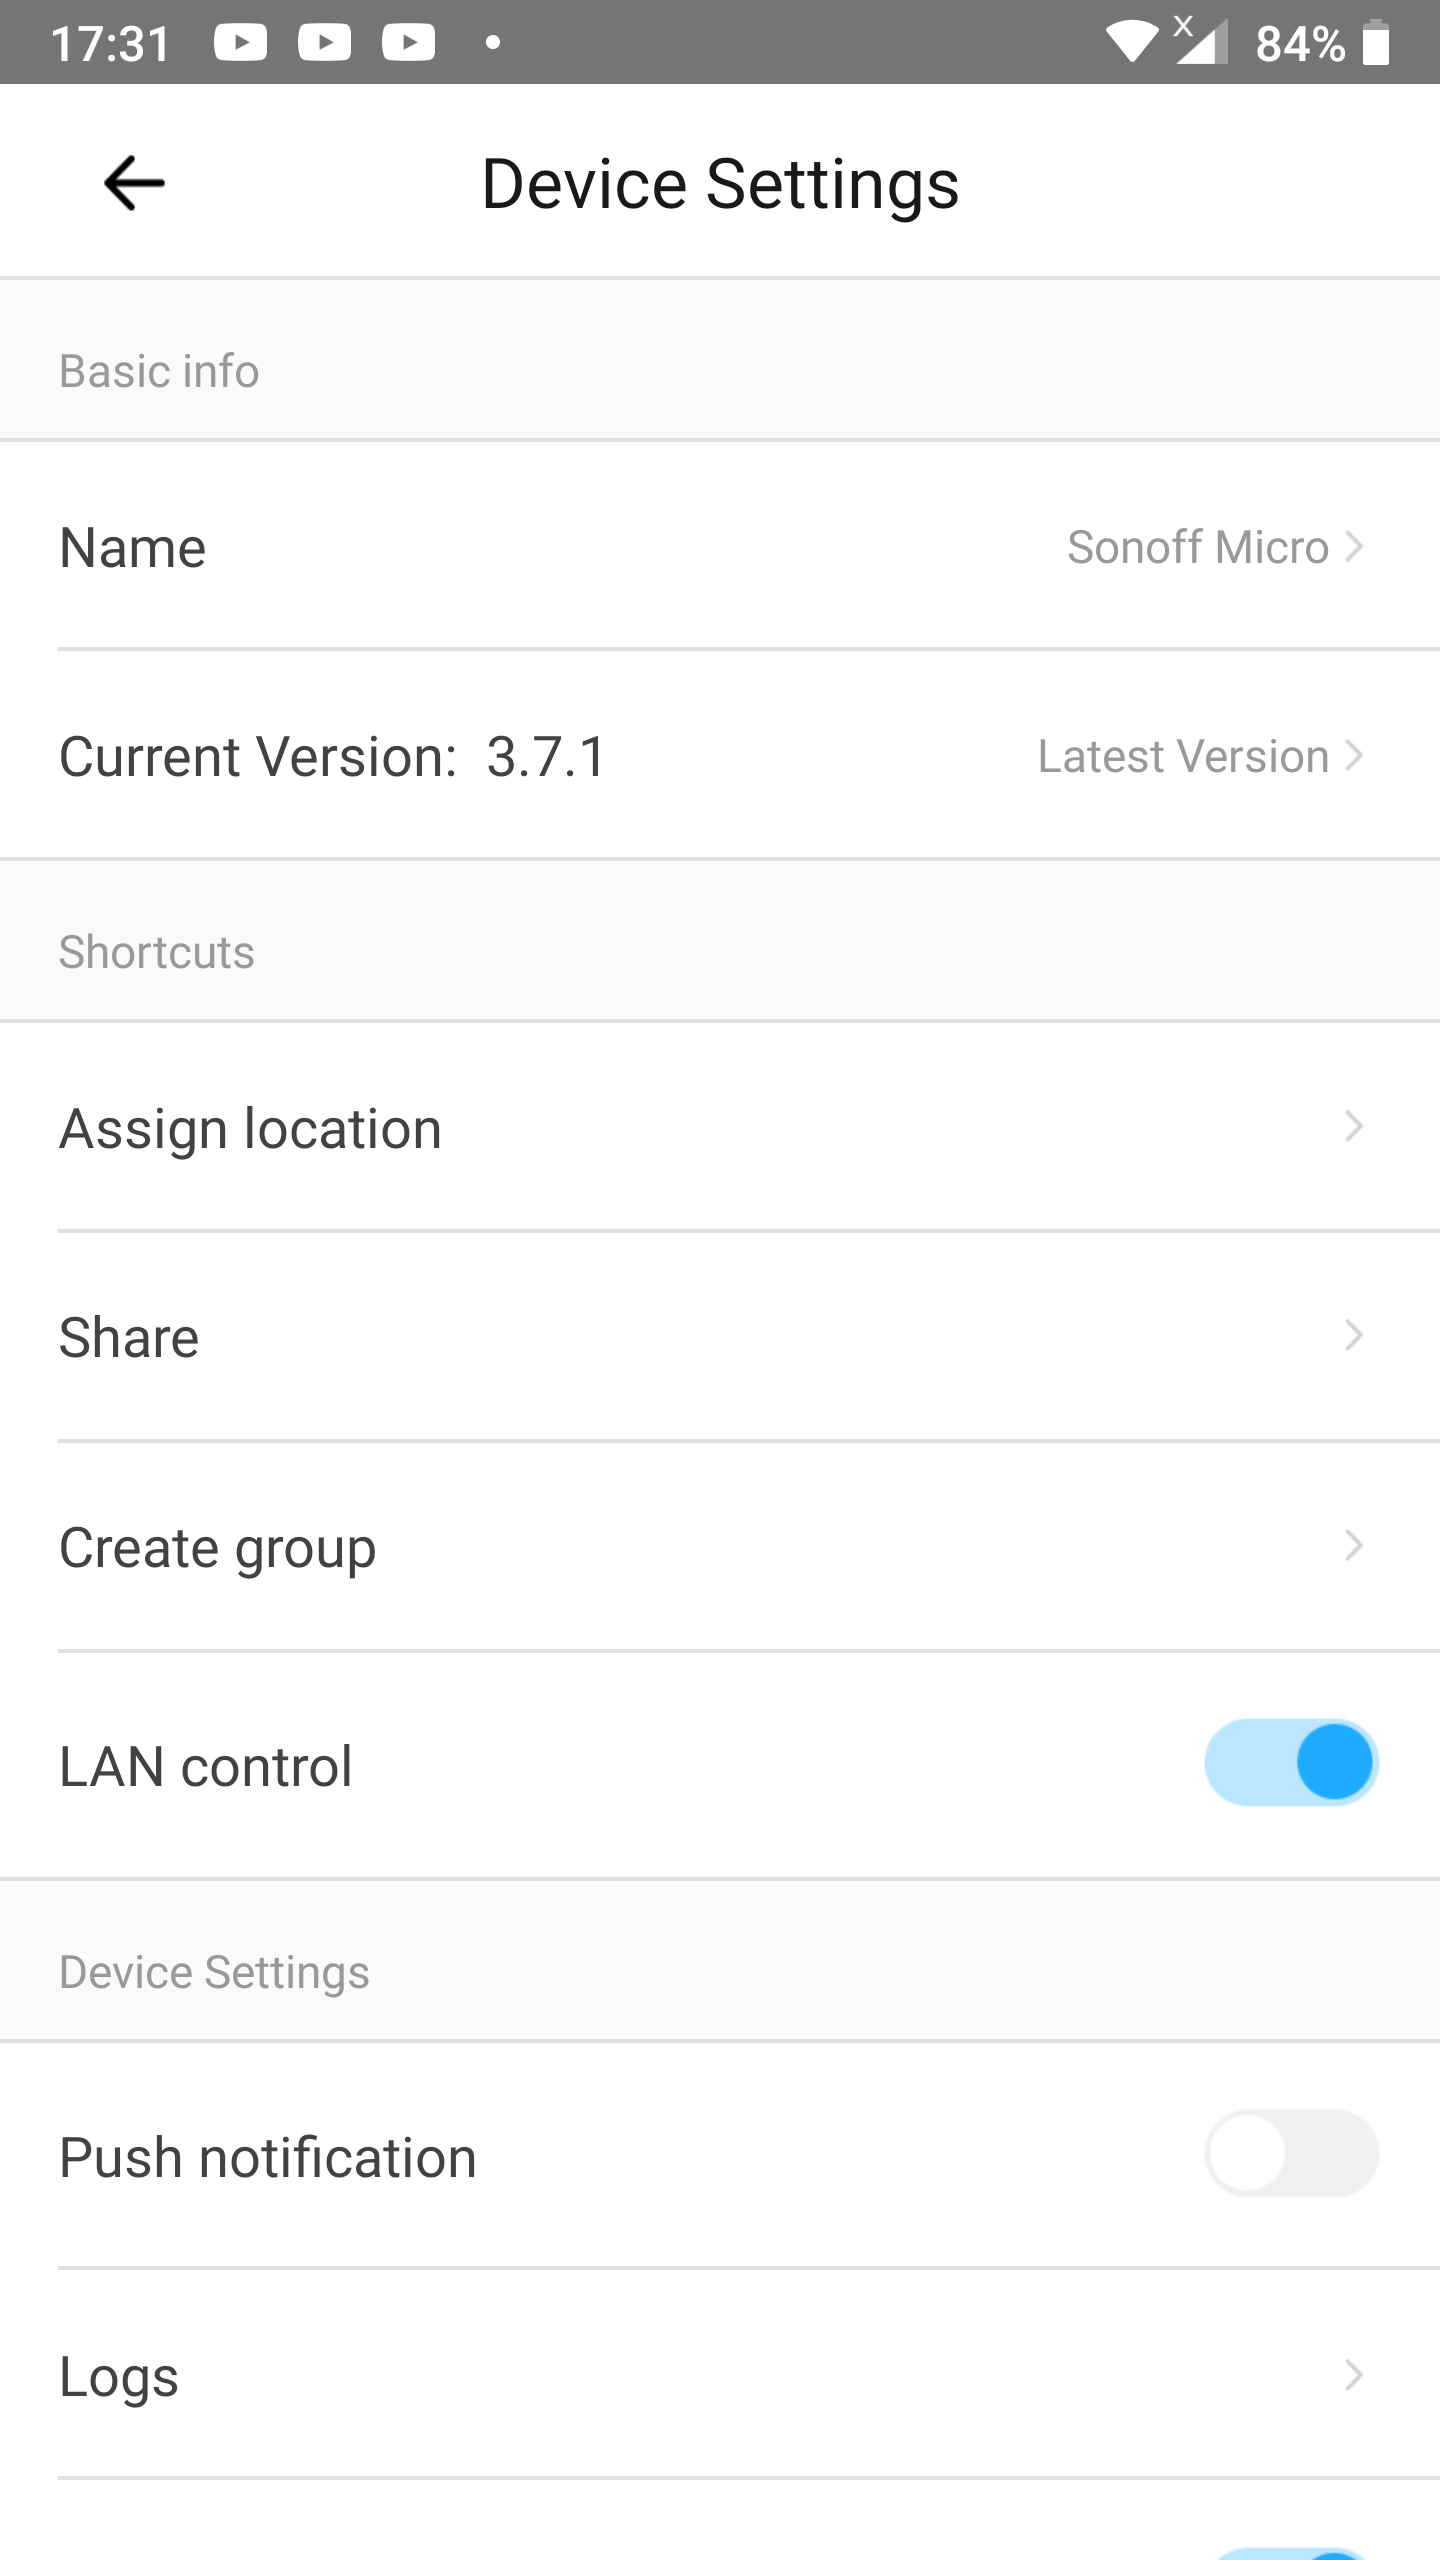
- In the
Device Settingsscreen tapLogs.
Step 4
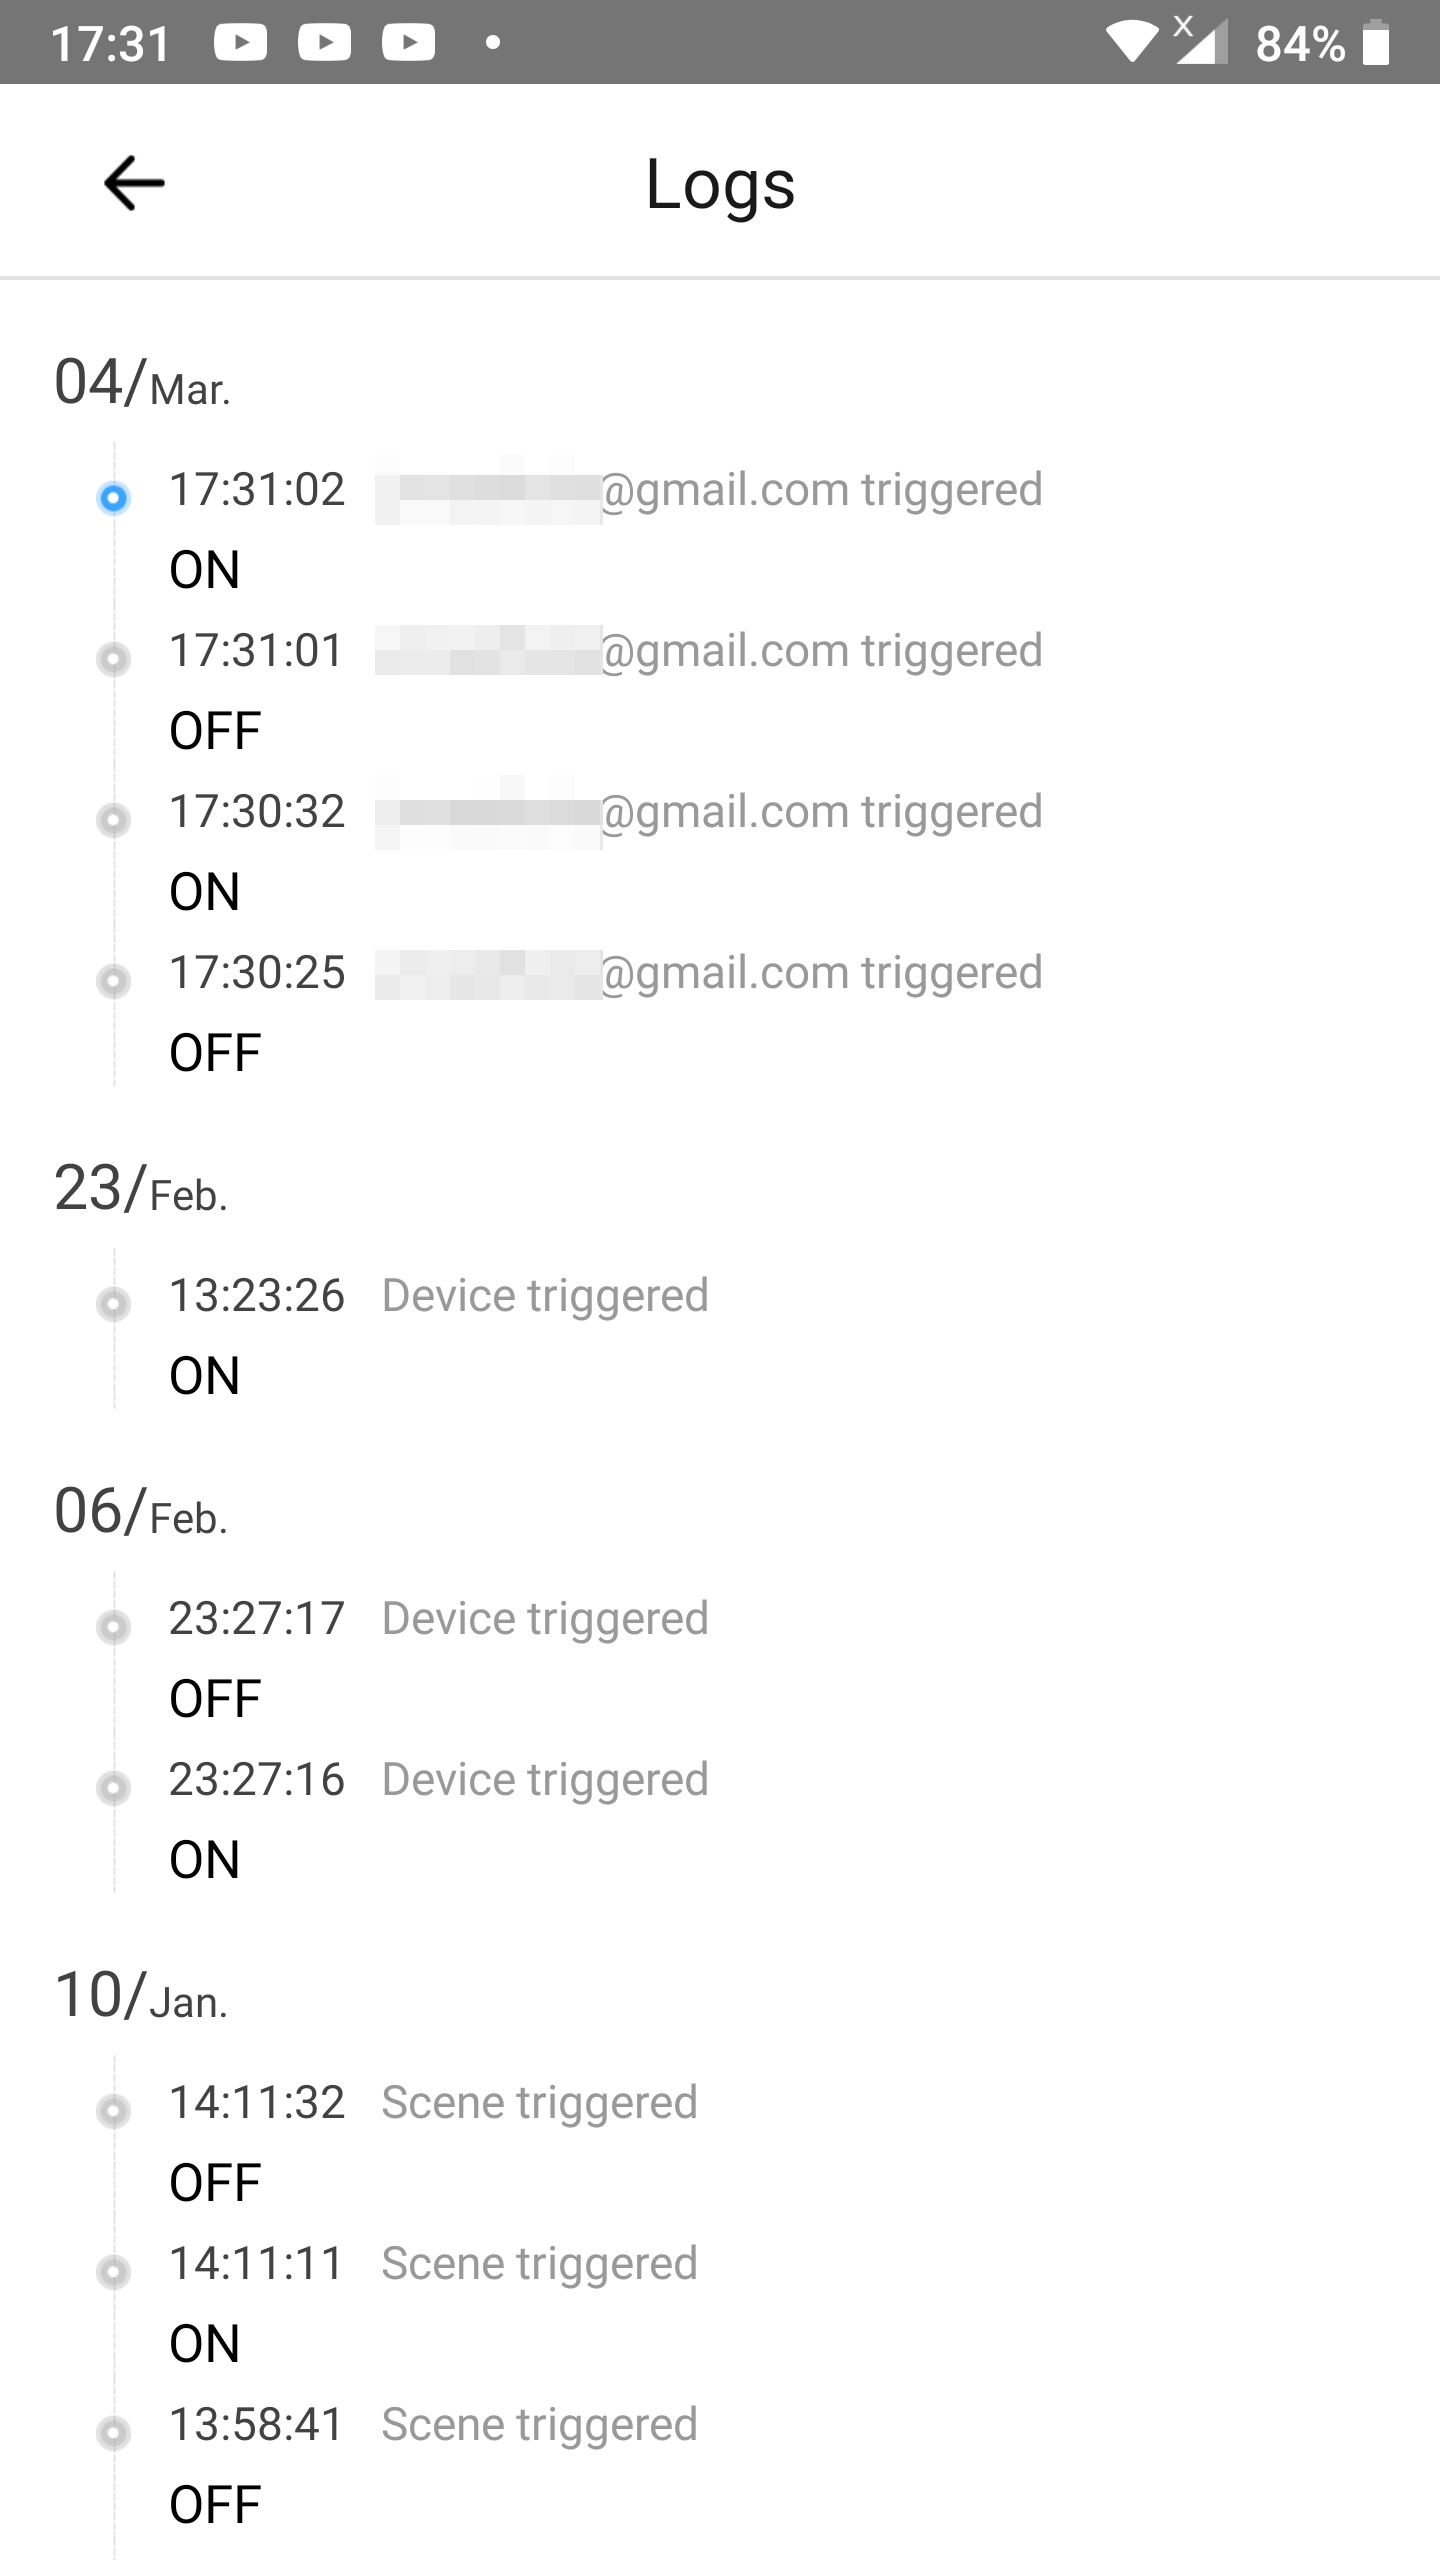
- Have a look at the logs.
- This is the explanation of the sources:
<emailaddress> triggeredmeans that the action is triggered by a manual action in the eWeLink app.Device triggeredmeans that the action is triggered by a manual operation on the device itself. This can be either a press on a button or operation by a RF remote that is directly connected to a RF device like the Sonoff Basic RF or the Sonoff 4CHPROR3.Scene triggeredmeans that the action is performed by automation. This can be either a scene in the eWeLink app or Google Home, Amazon Alexa, IFTTT, SmartThings, etc.
- Right below the trigger time an source you see the action that is performed. In our example of a single channel device it is just
ONorOFFbut on a multichannel device the channel is also specified and so statusses can be linkeCH 1 ON,CH2 OFF, etc.
Scene logs of a manual (tap-to-perform) scene
The second spot to find logs are at the scenes. When you created an automation with eWeLink’s scenes you want to know whether the scene has run or not. Especially when you encounter issues with scenes.
These instructions are about manual (tap-to-perform) scenes.
Step 1
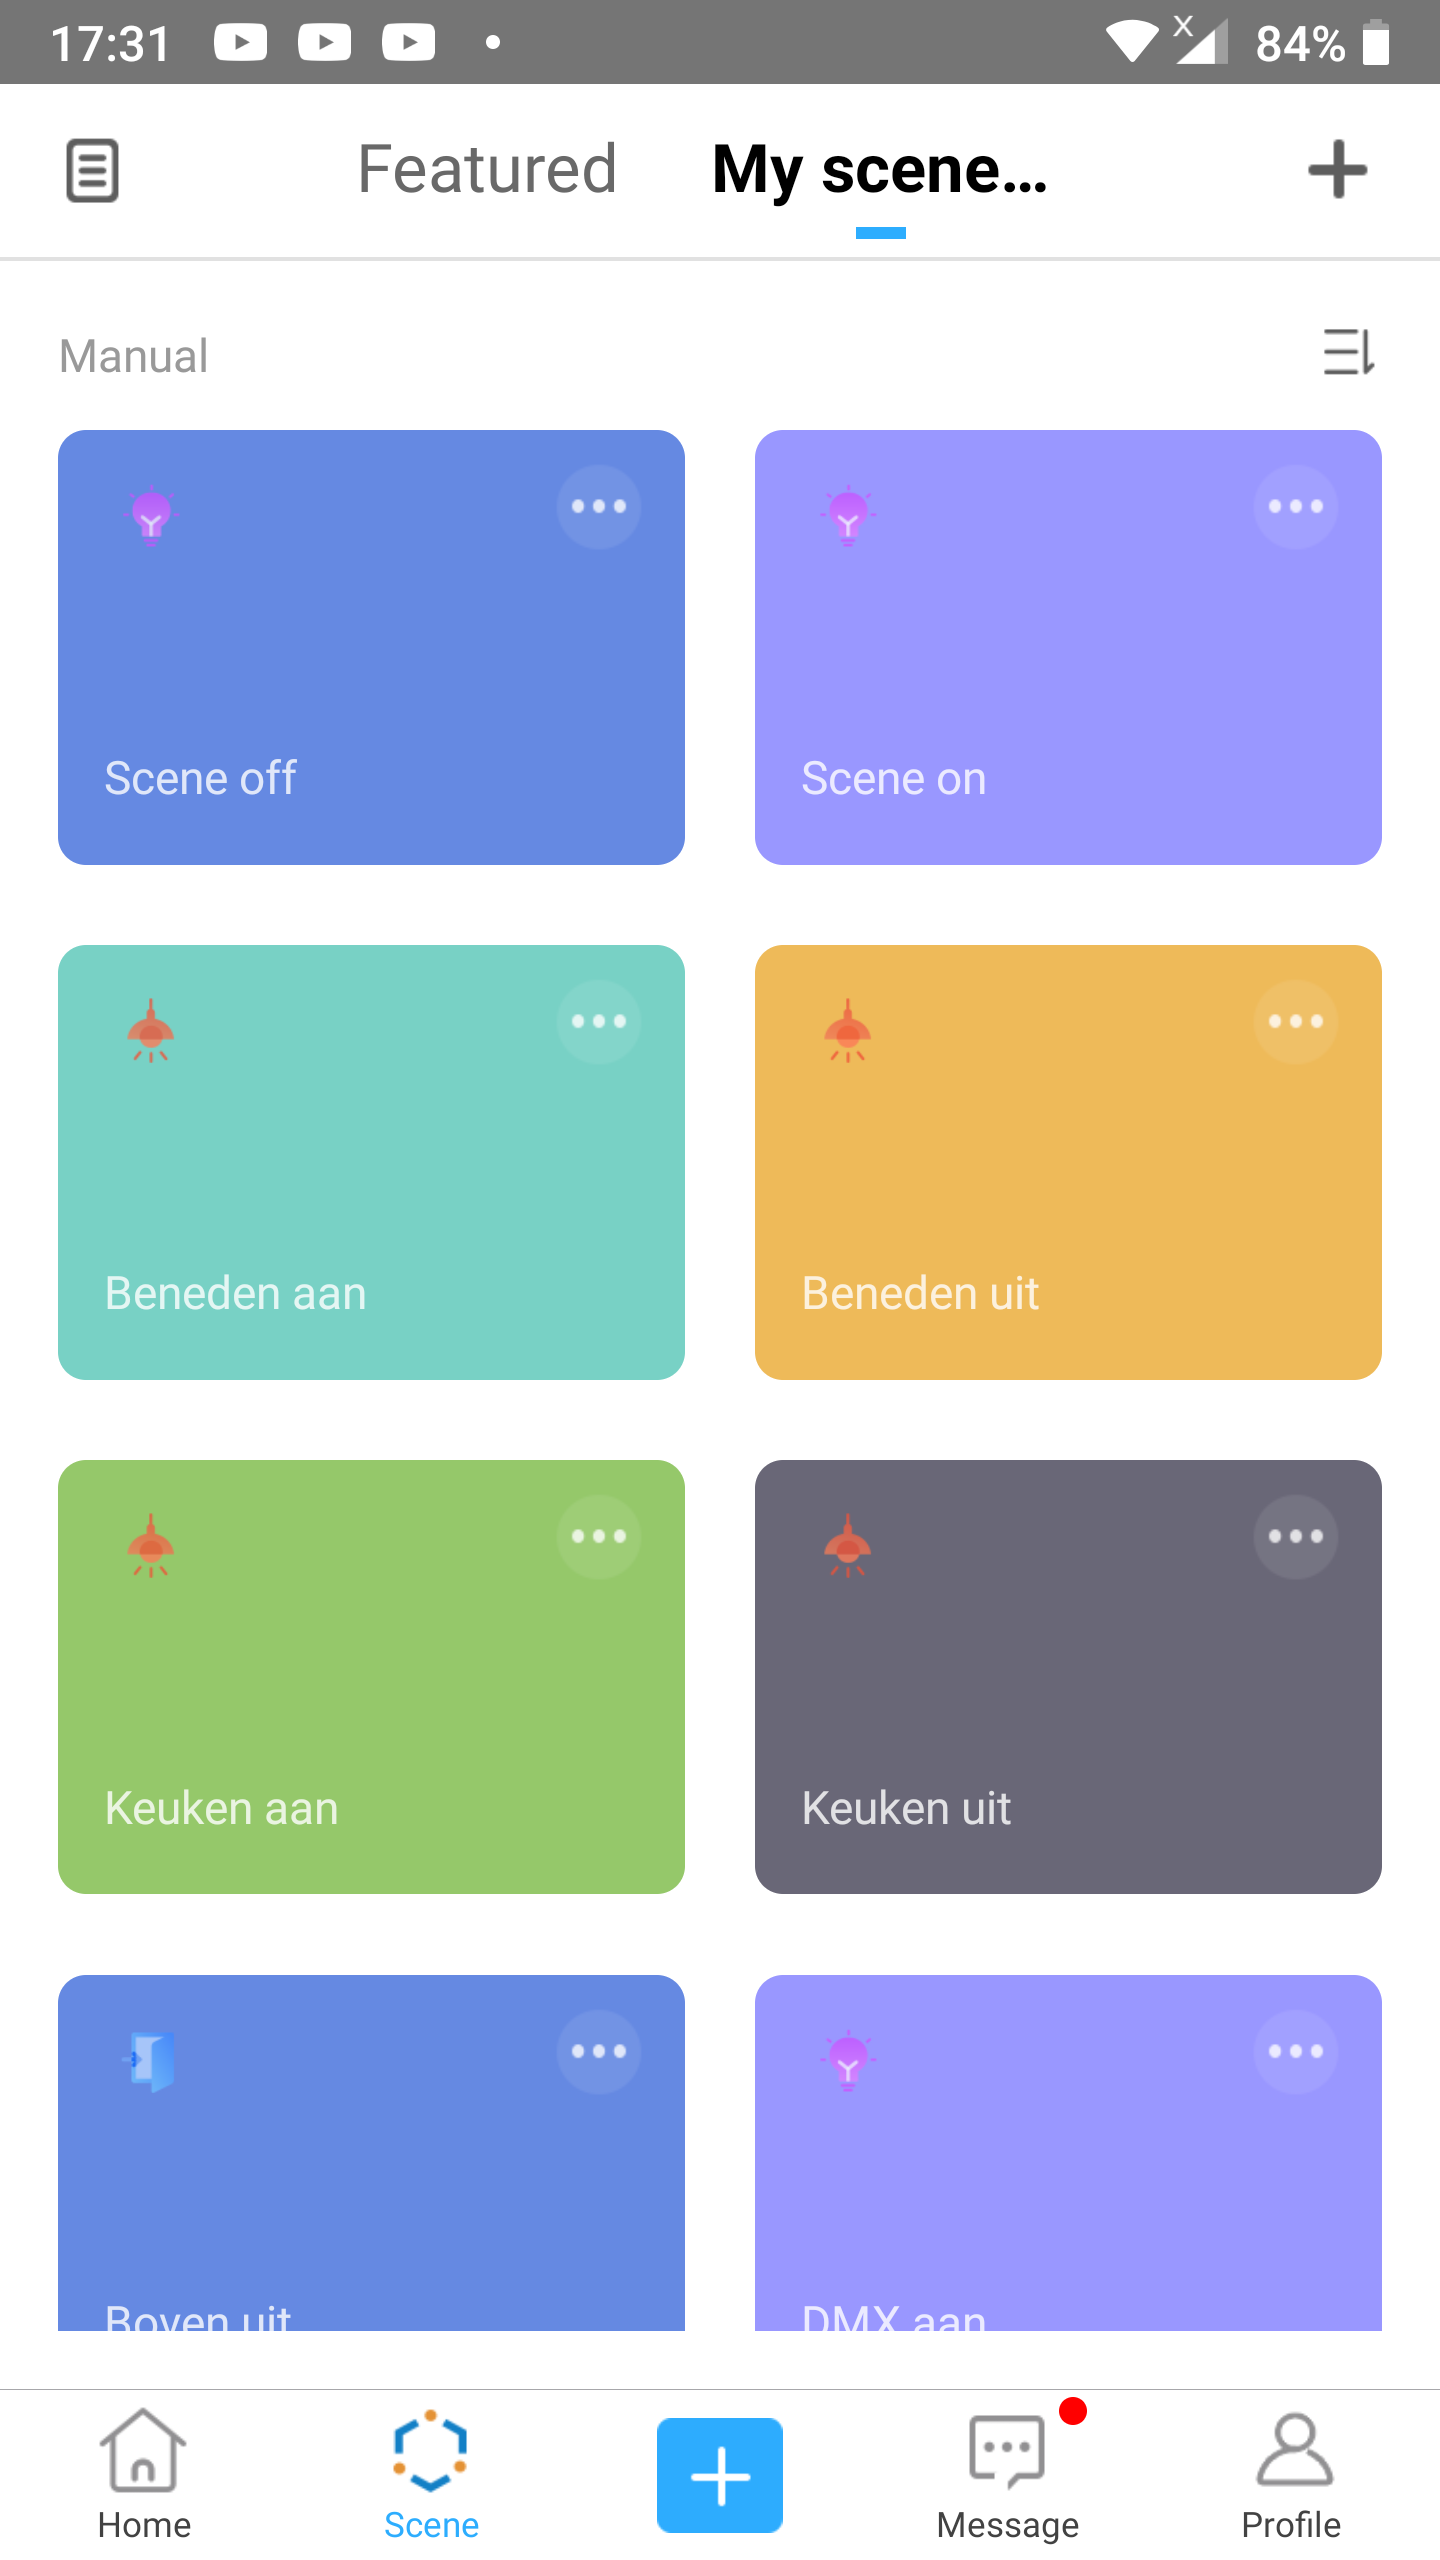
- Go to the
Scenesscreen. - Tap the document icon in the top left corner.
Step 2
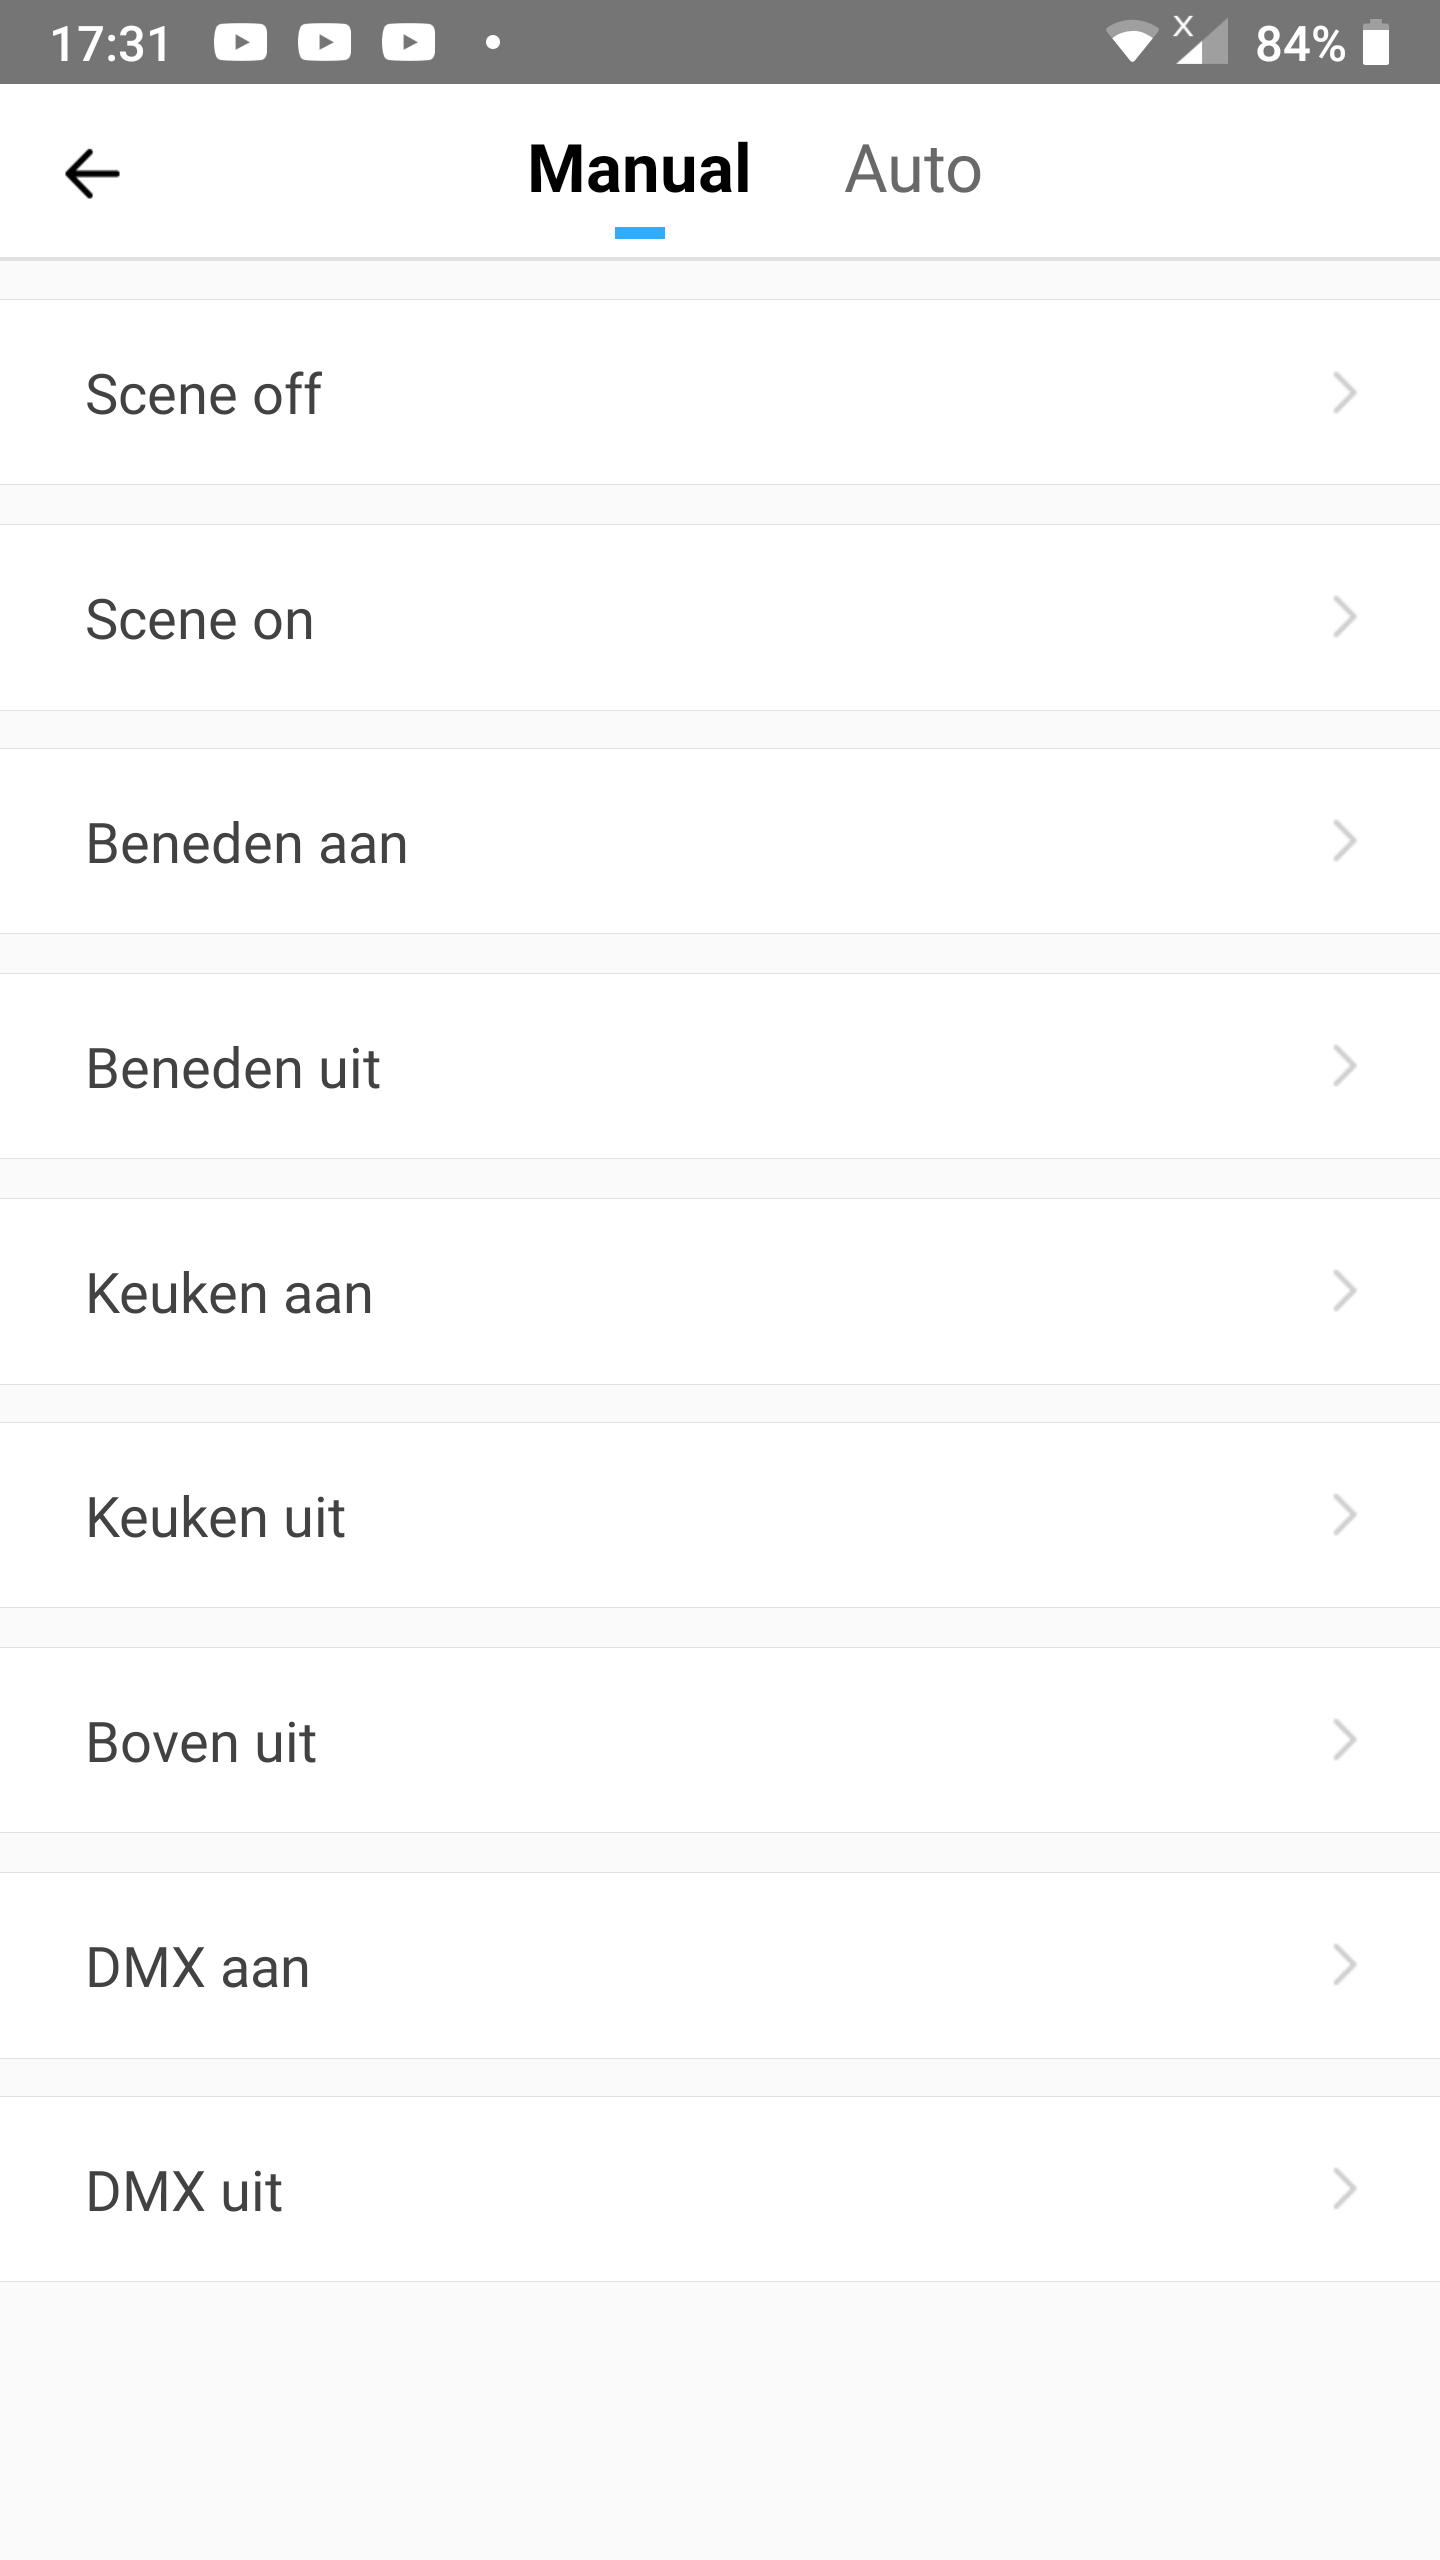
- Tap the tab
Manual. - Tap the scene of which you want to view the logs.
- In our example we choose
Scene off.
- In our example we choose
Step 3
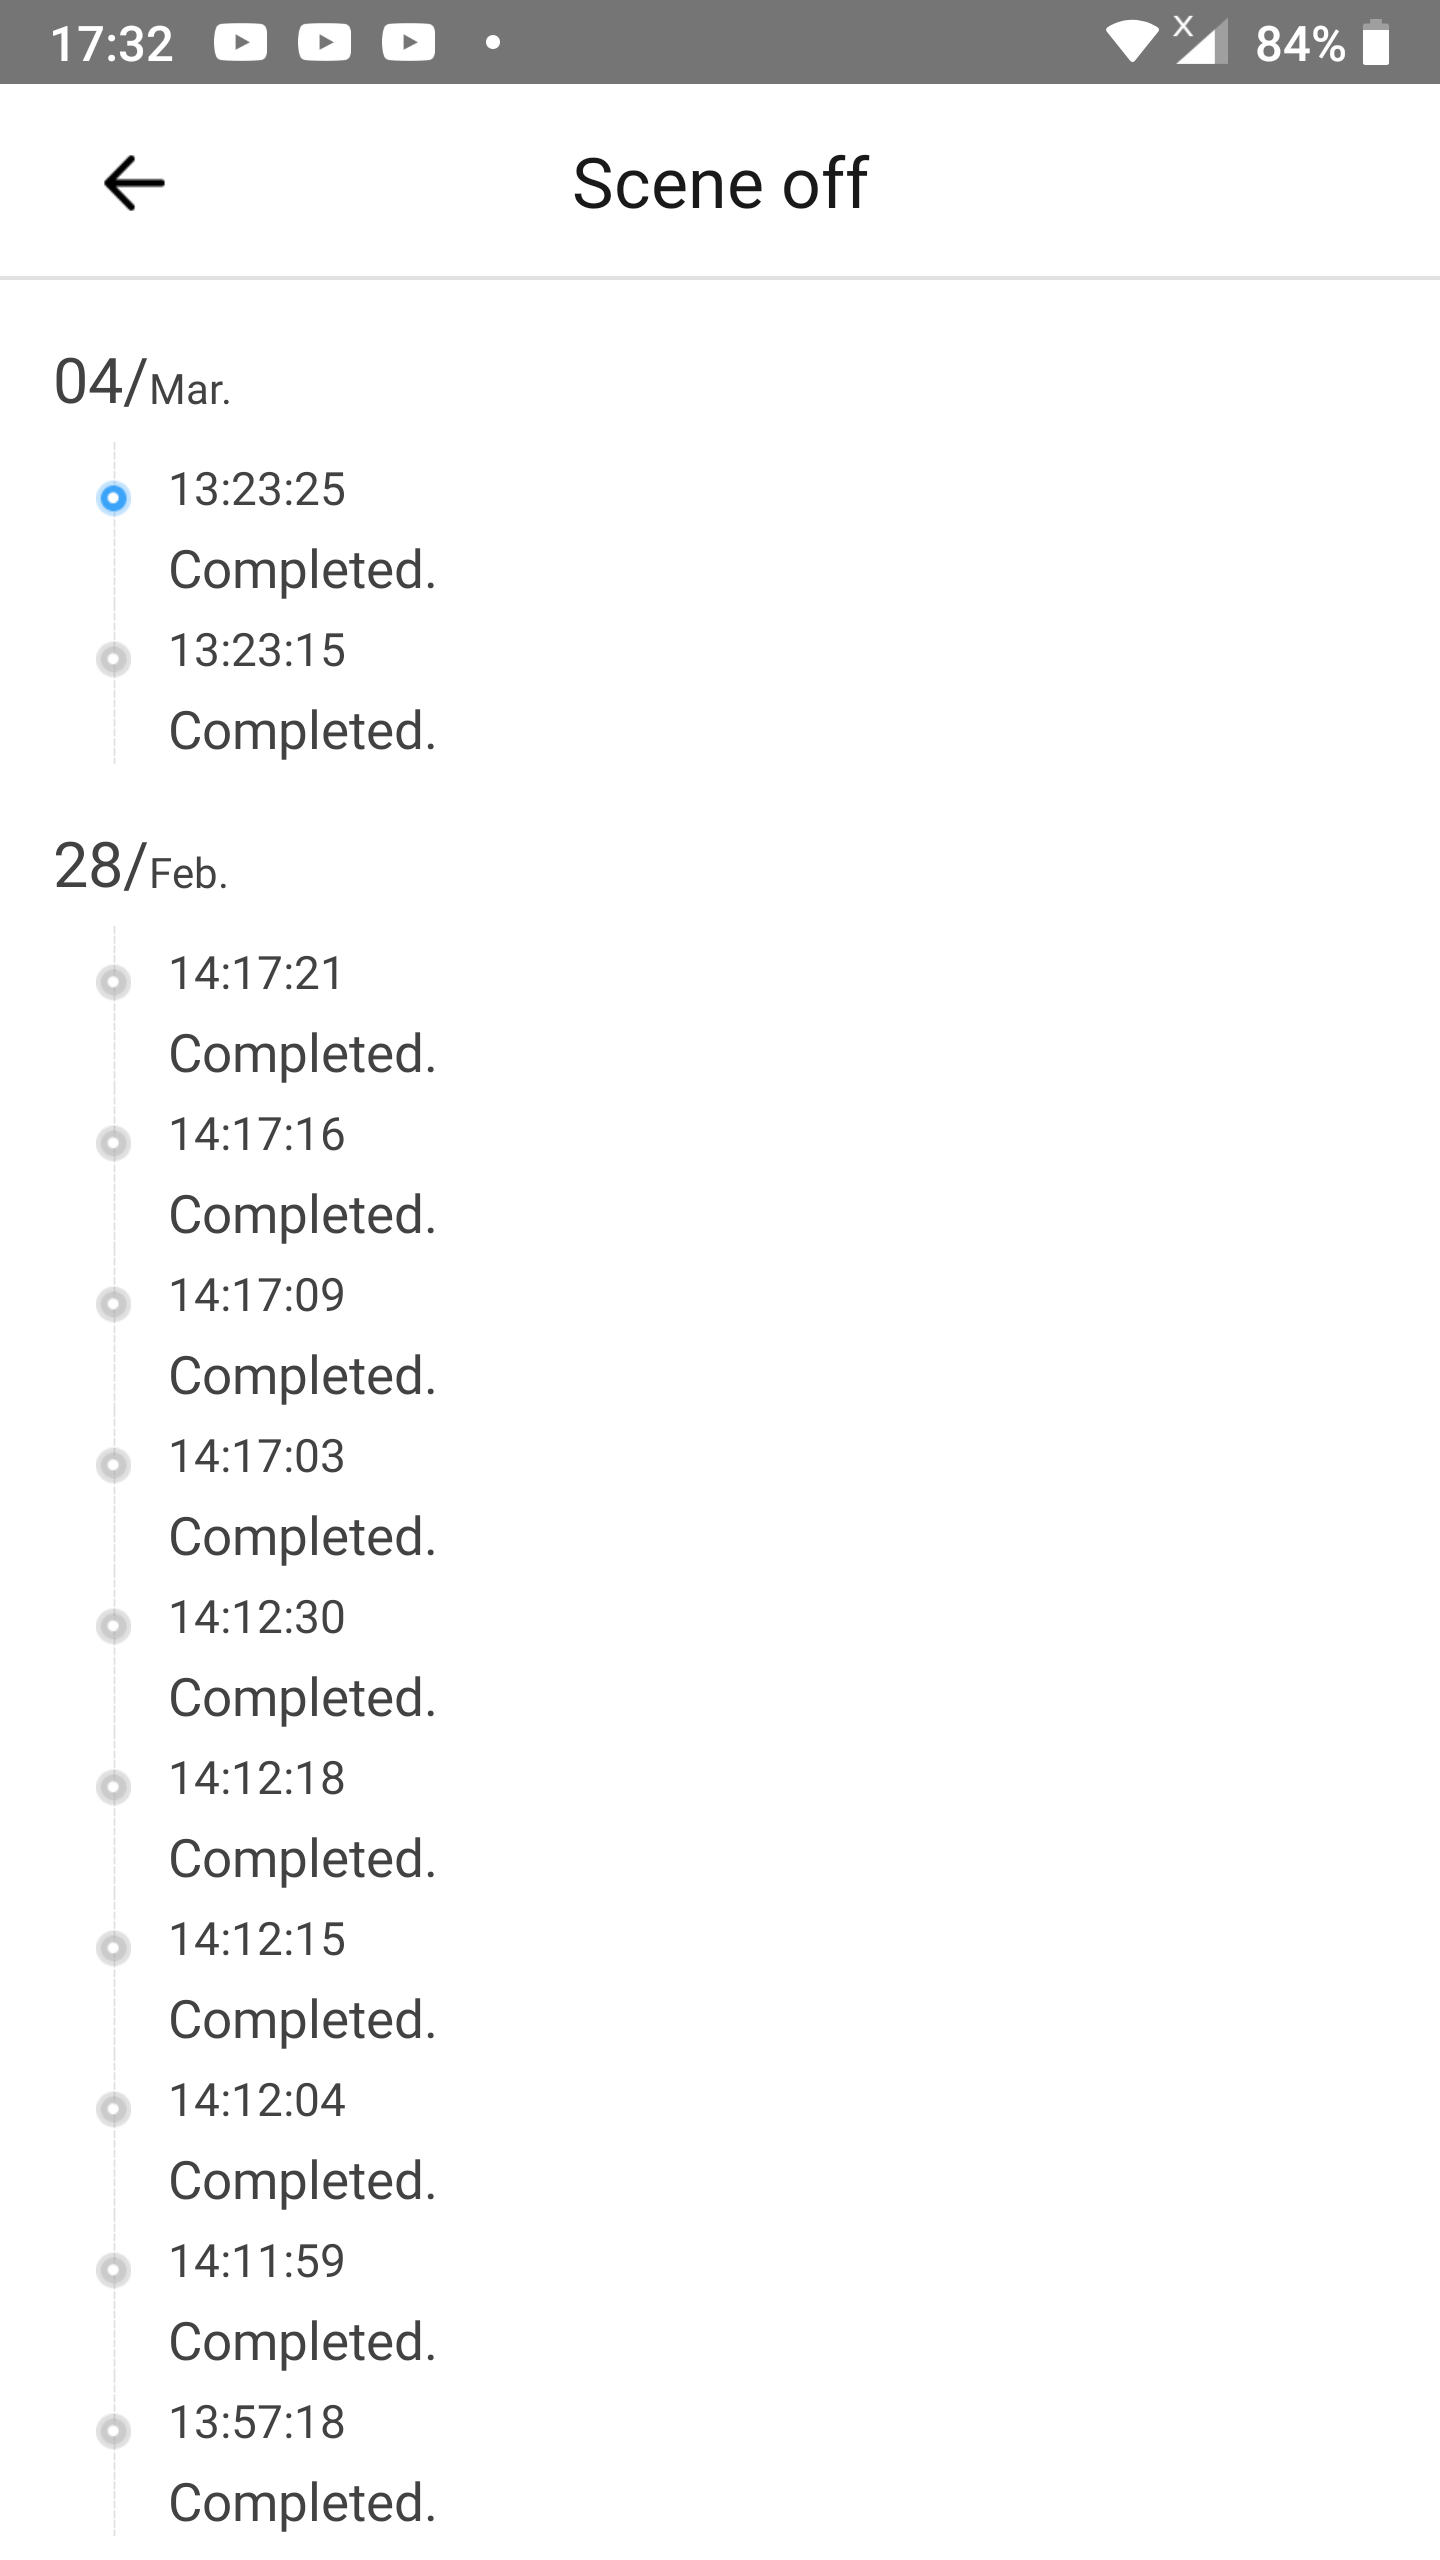
- Have a look at the logs.
- Each entry can have 1 of these 2 statusses:
Completed: The scene have succesfully been executed.Failed(in red): The scene has failed to execute.
Scene logs of a auto scene
The second spot to find logs are at the scenes. When you created an automation with eWeLink’s scenes you want to know whether the scene has run or not. Especially when you encounter issues with scenes.
These instructions are about automatic scenes.
Step 1
- Go to the Scenes screen.
- Tap the document icon in the top left corner.

Step 2
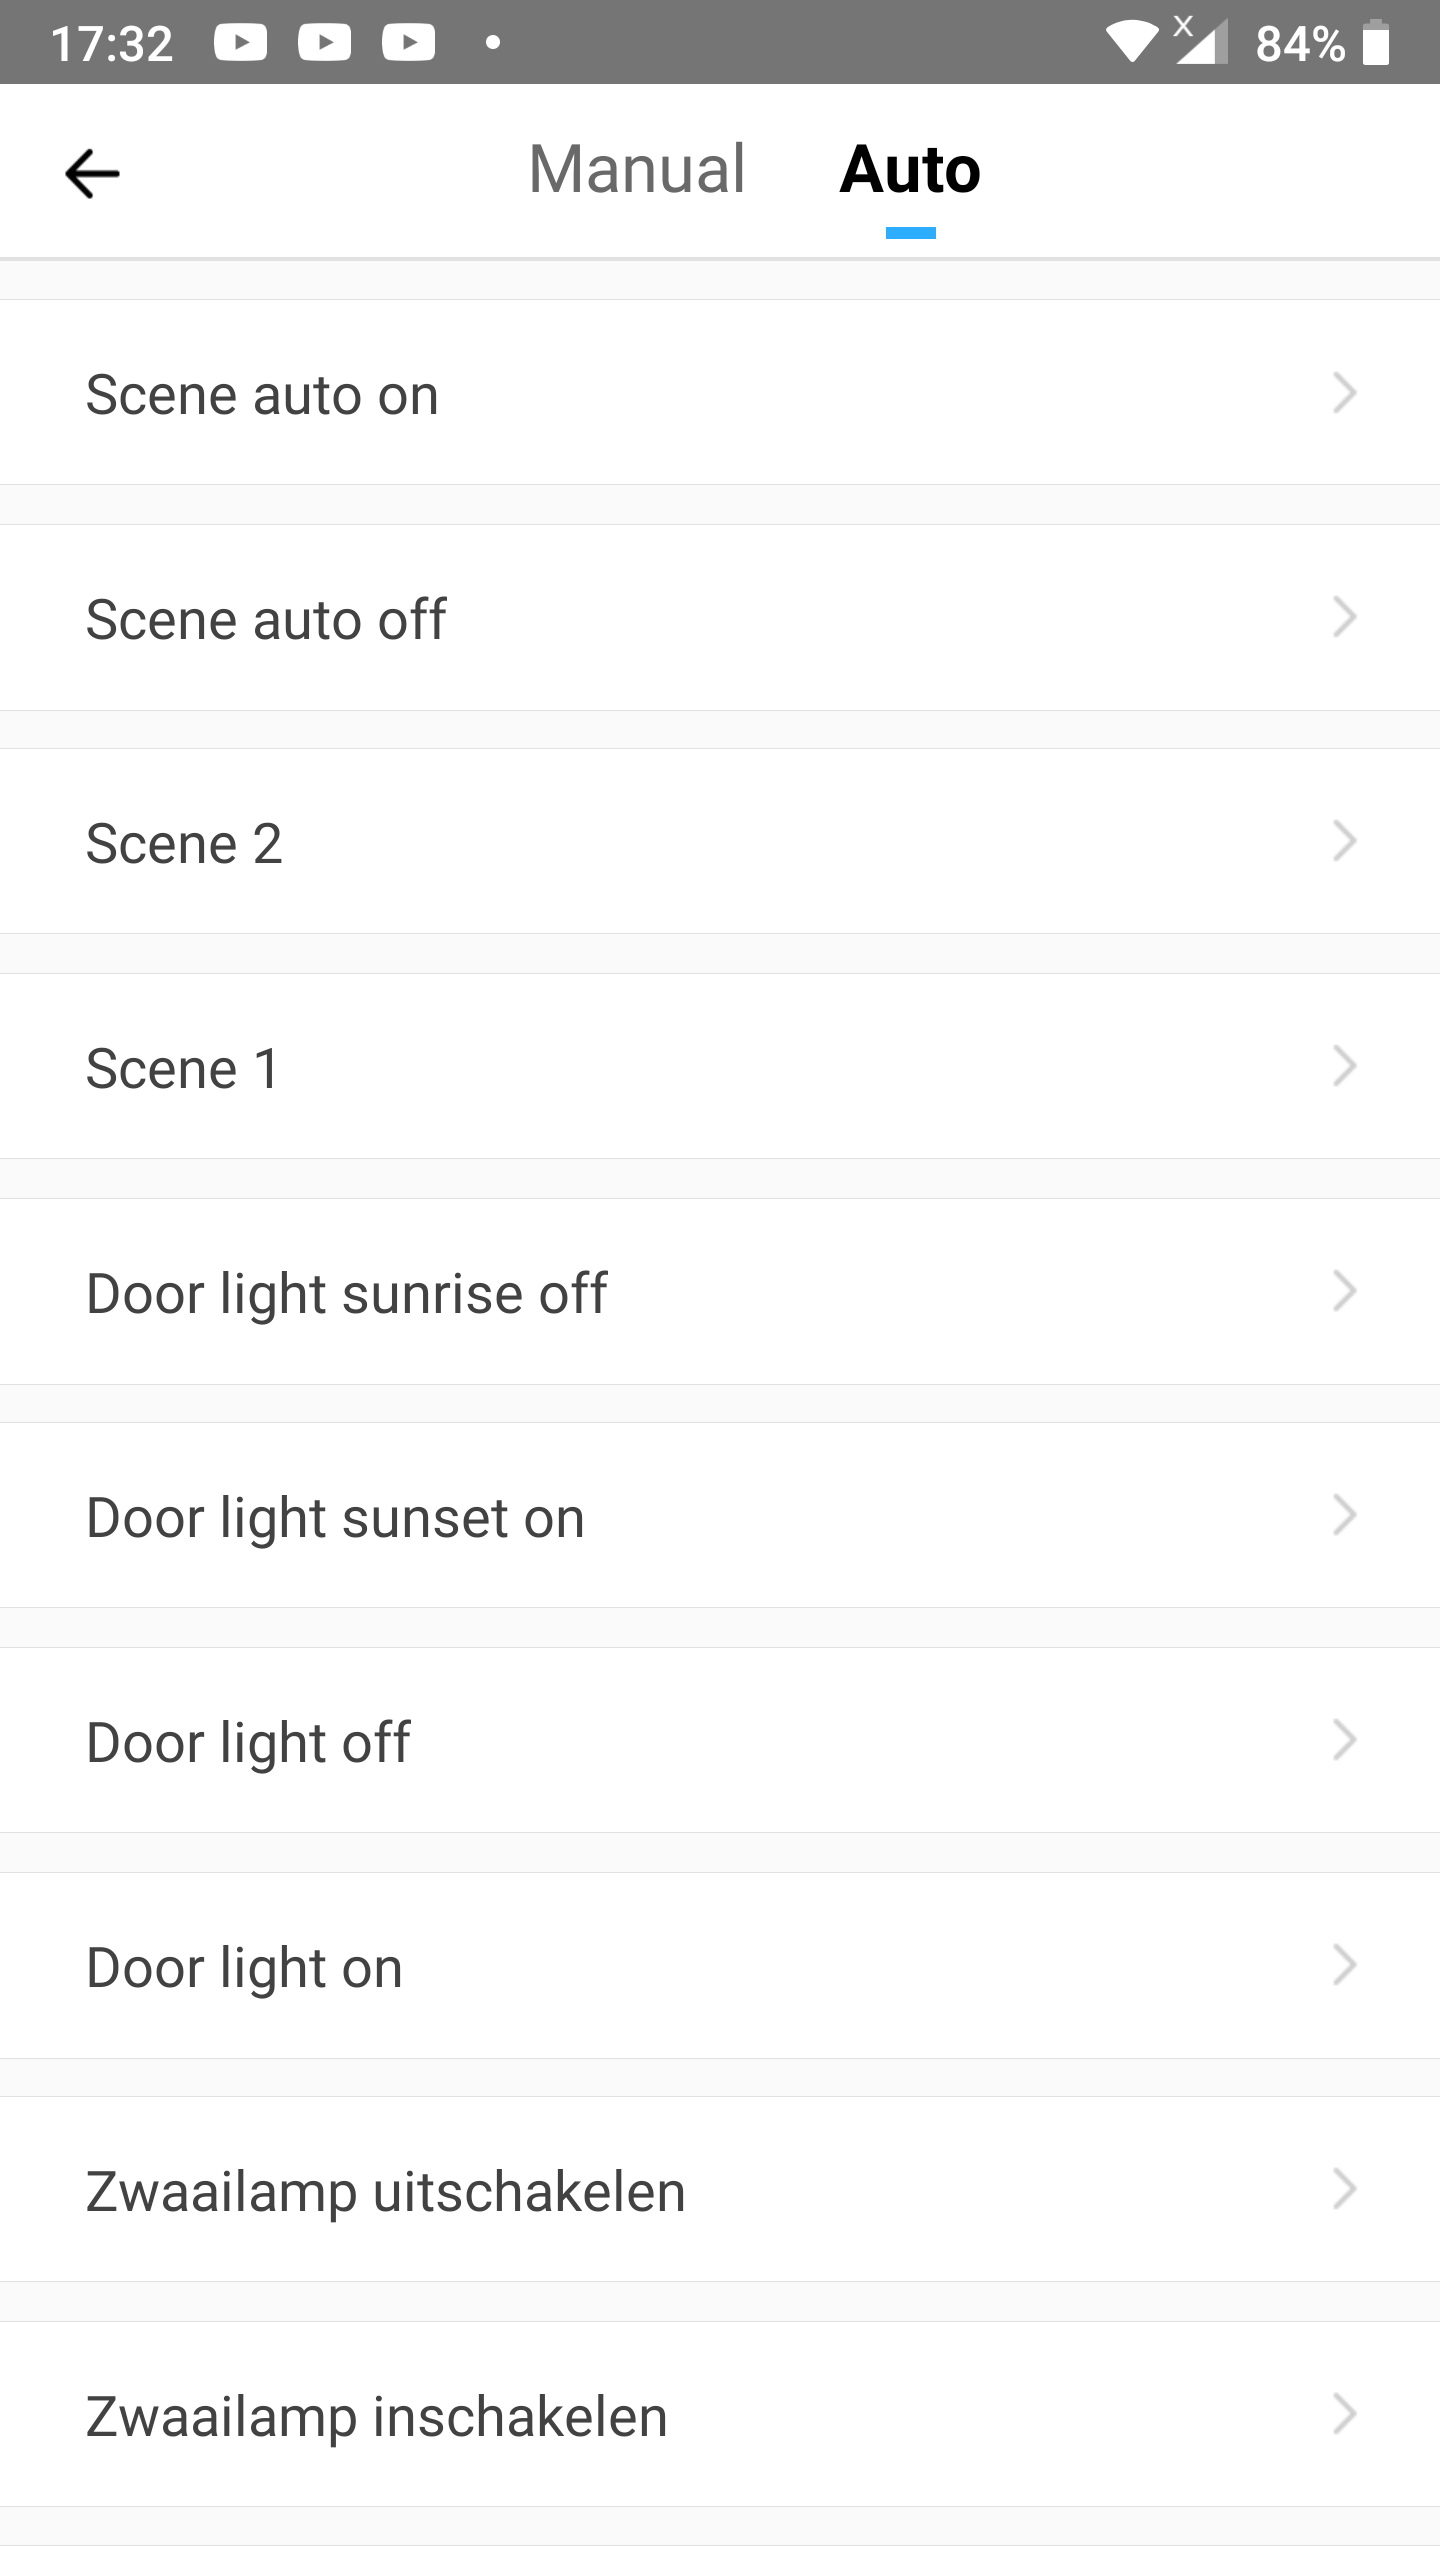
- Tap the tab
Auto. - Tap the scene of which you want to view the logs.
- In our example we choose
Scene auto off.
- In our example we choose
Step 3
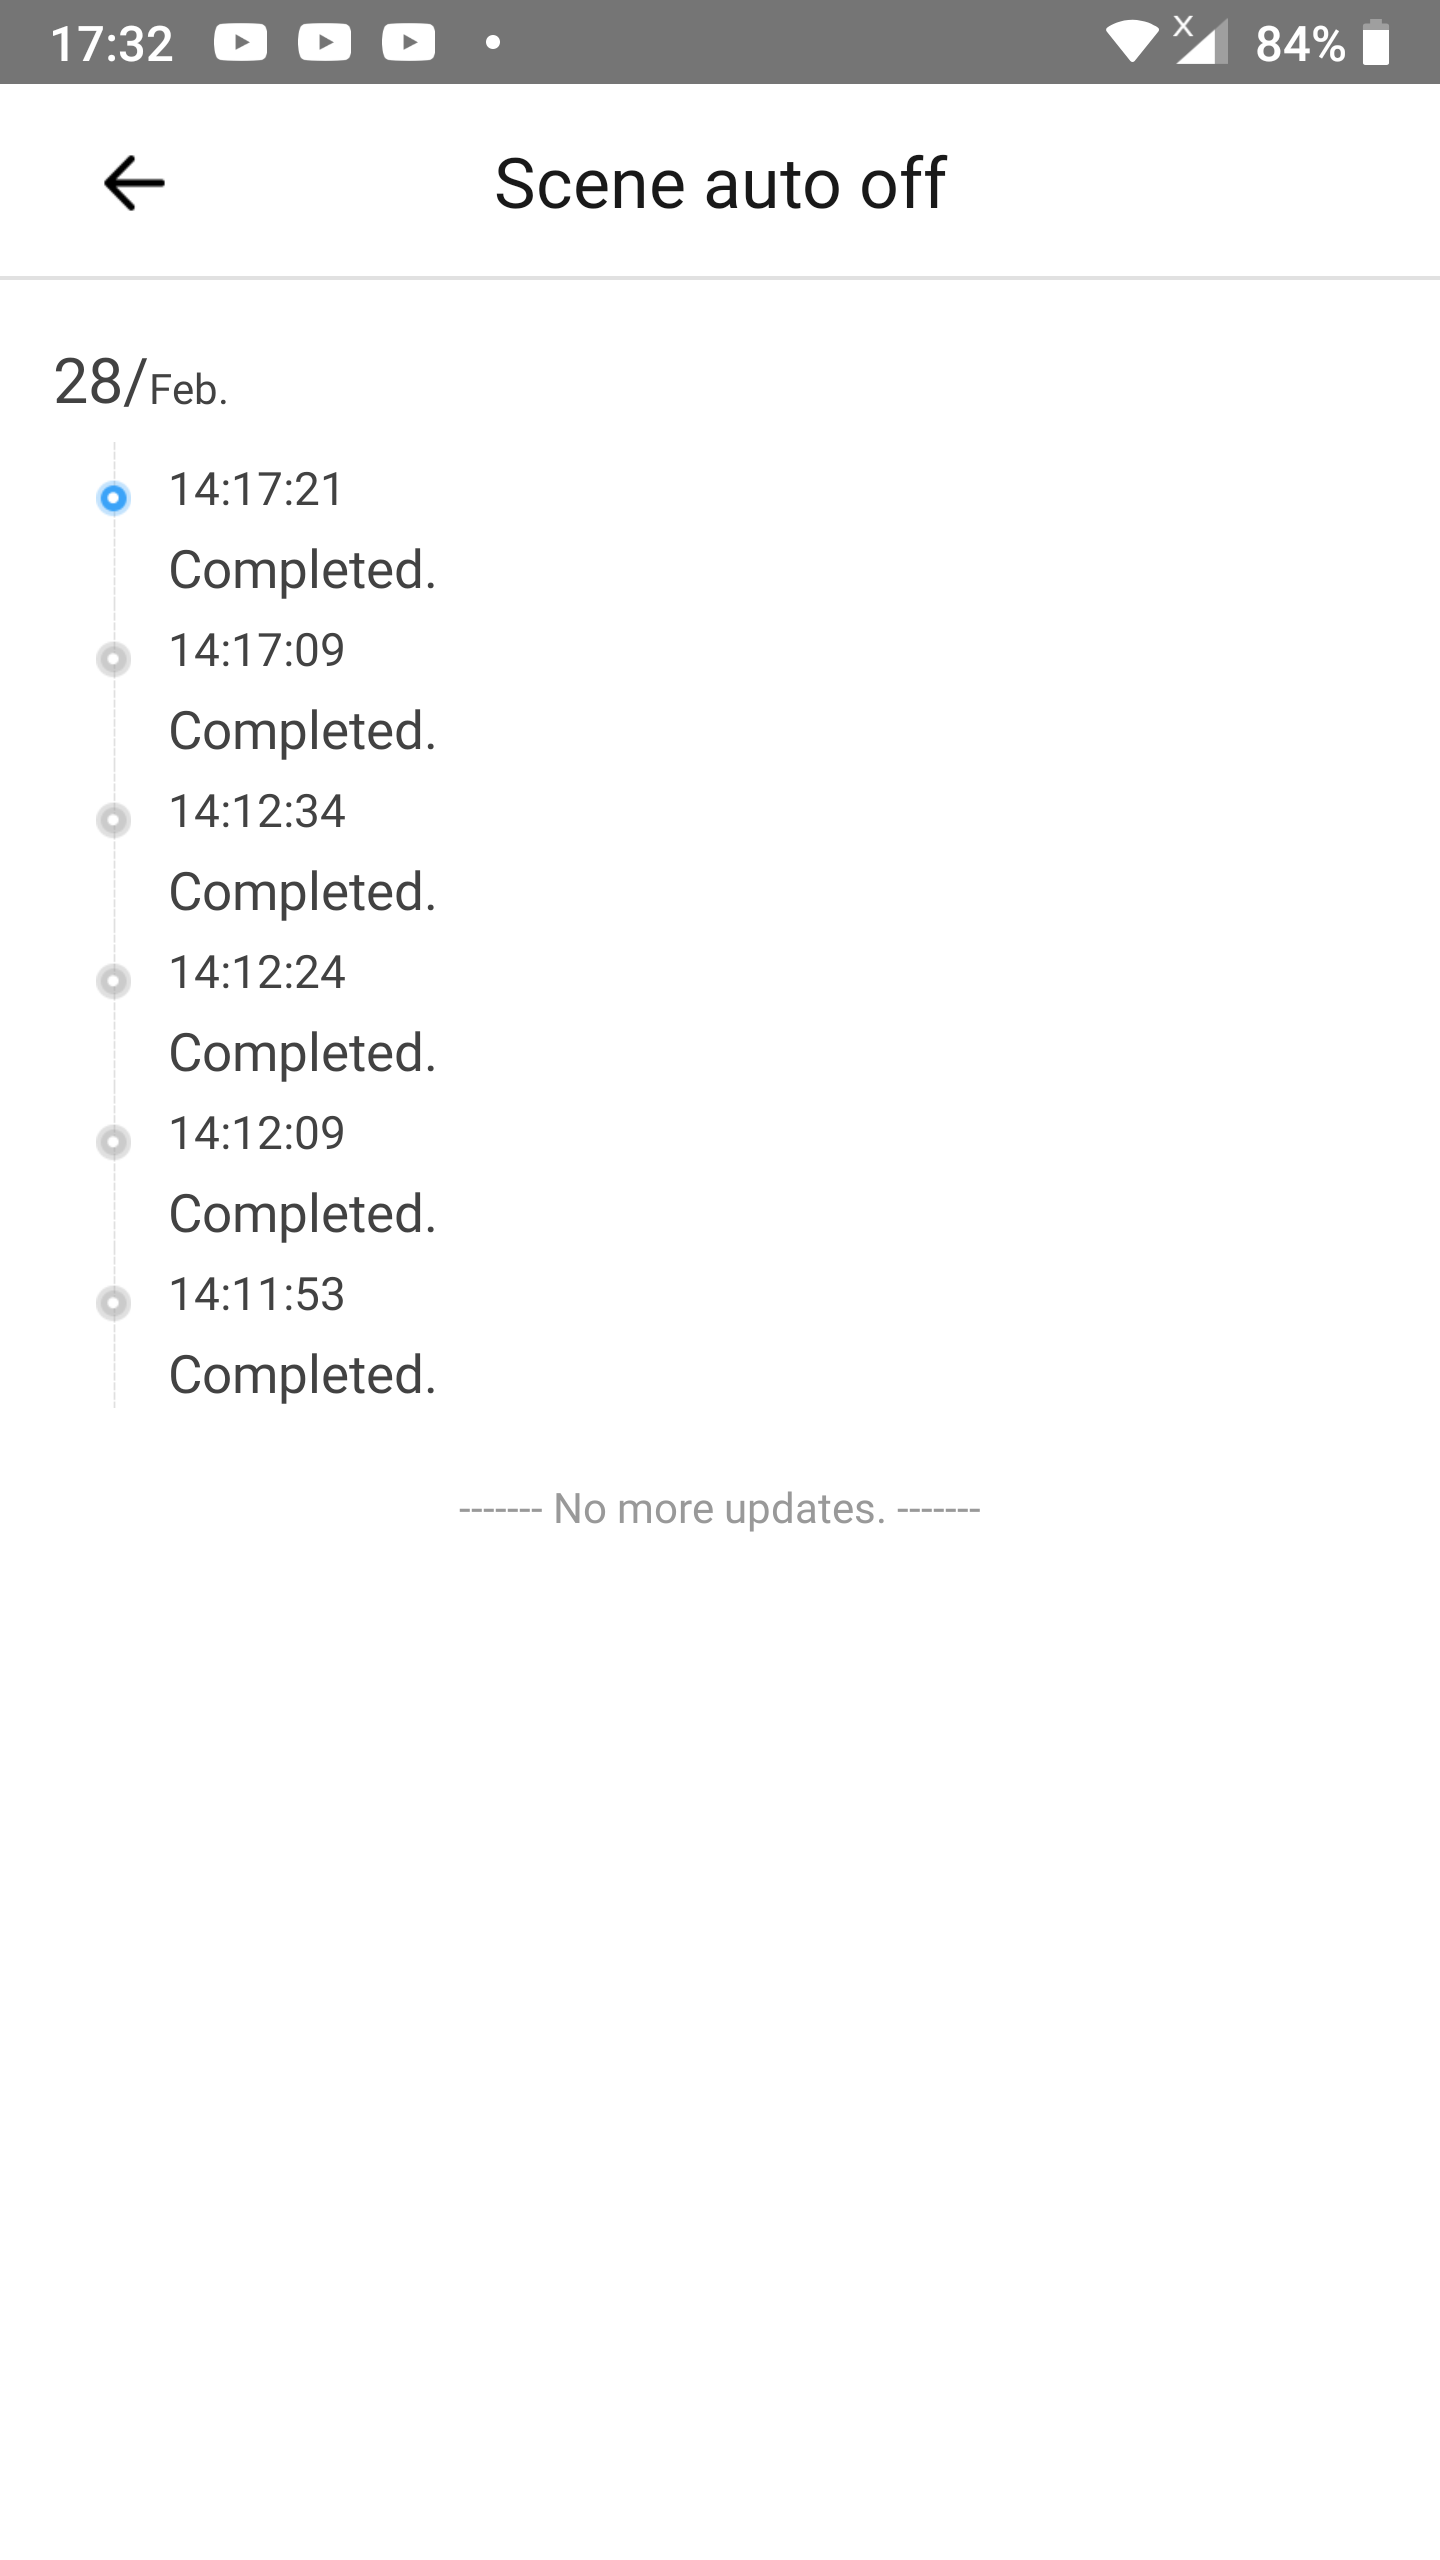
- Have a look at the logs.
- Each entry can have 1 of these 2 statusses:
Completed: The scene have succesfully been executed.Failed(in red): The scene has failed to execute.

You must be logged in to post a comment.